Ropes and tiny ropes can have a crucial role in the daily working routine. They usually lift something more valuable than their pure cost. Their strategic importance is expressed in production line, where a stop due to a broken wire can cost hundreds of thousands of euro per hour. These ropes need to be monitored 24 hours on 7 days.
In this article, we will explain you the importance of the predictive analysis and threshold alarm through a permanent installation.
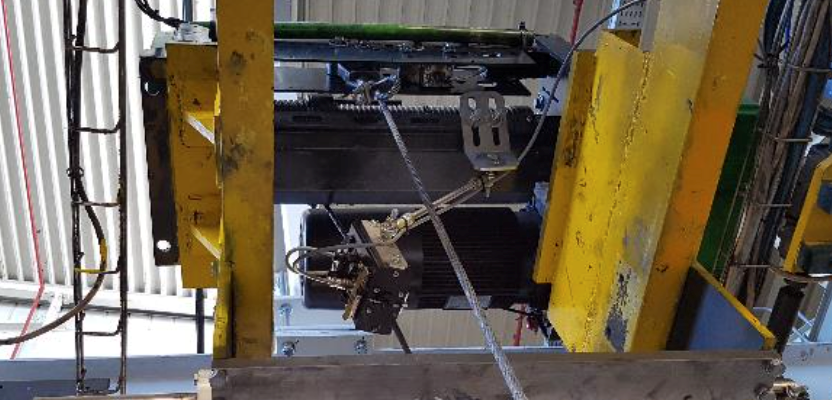
A permanent installation is made of a fix device, a local acquisition system and IOT monitoring. The system must be installed in a stable position to guarantee a correct functioning all along its life cycle. In this way preventing rope break, it would be possible to avoid production stop and damage to people and goods.

This solution is constituted by an MRT sensor positioned on the crane, that can continuously monitor the rope condition, and an intelligent unit calculating a descriptive parameter about the steel wire rope status. This parameter will be sent through the network (ex. wifi) to a data centre positioned in the same location, or 1000 km far, and the maintenance team is alerted when there is a real need of an inspection. At the same time, when the standard control is performed, the technician knows exactly in advance the condition of the rope and can optimize its job.

1. Gauge & treshold alarm
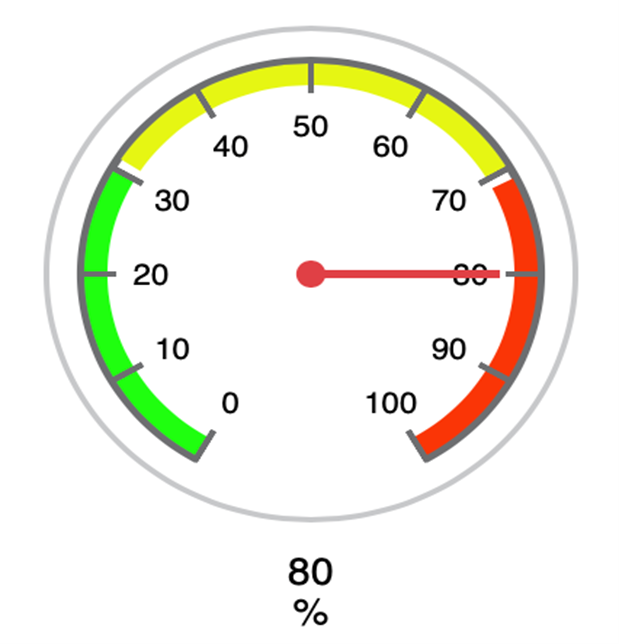
The inspection data are daily sent to the inspection centre, which can be an app or an HTML page. The maintainers accessing at this page can look at the status of the rope through a gauge.
Each coloured area represents a defined status of the rope:
- Green: the rope is in good condition
- Yellow: ask the maintainers for a deeper inspection
- Red: Stop the plant, (proceed only guided by the maintainer)
Each time the rope crosses an area an alert can be sent to the maintainer through message, email etc.
2. Predictive analysis
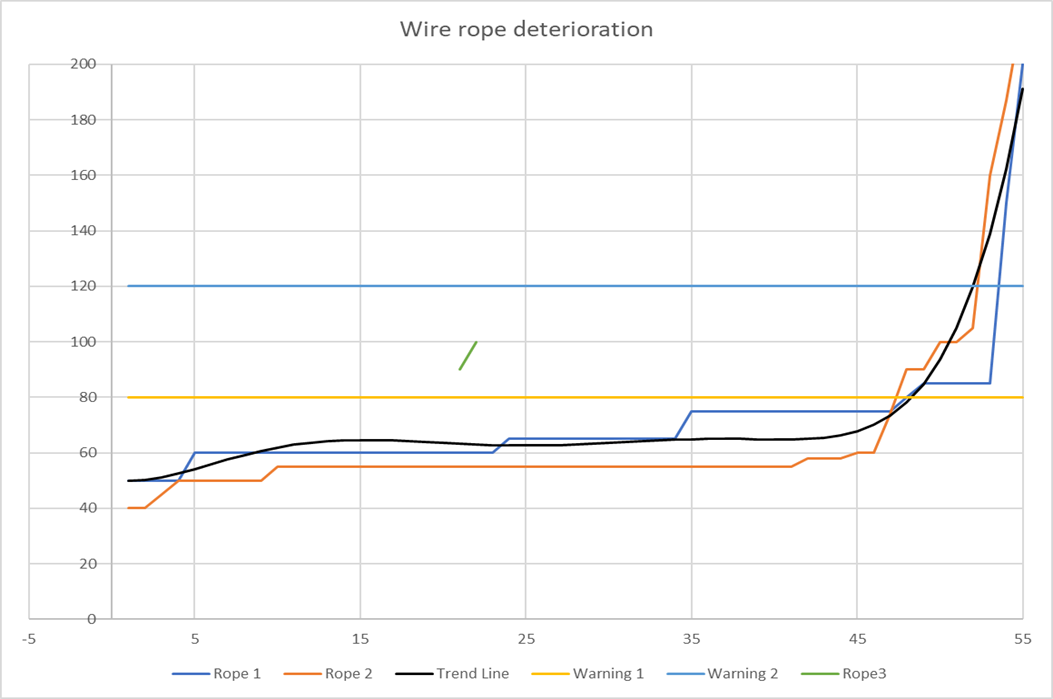
A constant control guarantees daily rope status data, which can allow the maintainer to build a predictive analysis.
The rope status can be evaluated day per day, building the relative graph (Picture 3.) The horizontal axe of the following graph is in time whilst the vertical is volt. Each point represents a specific status of the rope, the more is the rope deterioration the steeper the curve.
Through the analysis of the defects evolution the inspector will know the right time for rope replacement managing the full rope life cycle

More about Magnetic Rope Testing?
Discover our articles about Magnetic Rope Testing (MRT):
- When is an MRT suggested?
- Rope inspection, safety and the ISO4309 regulation
- The EN12927, is your MRT device in compliance with the standard?
- Localized Fault VS Loss of Metallic Area
- MRT-training
- The magnetization curve of a steel wire rope
- How is MRT equipment made
- How to choose an MRT device
- How to develop customized magneto-inductive equipment


